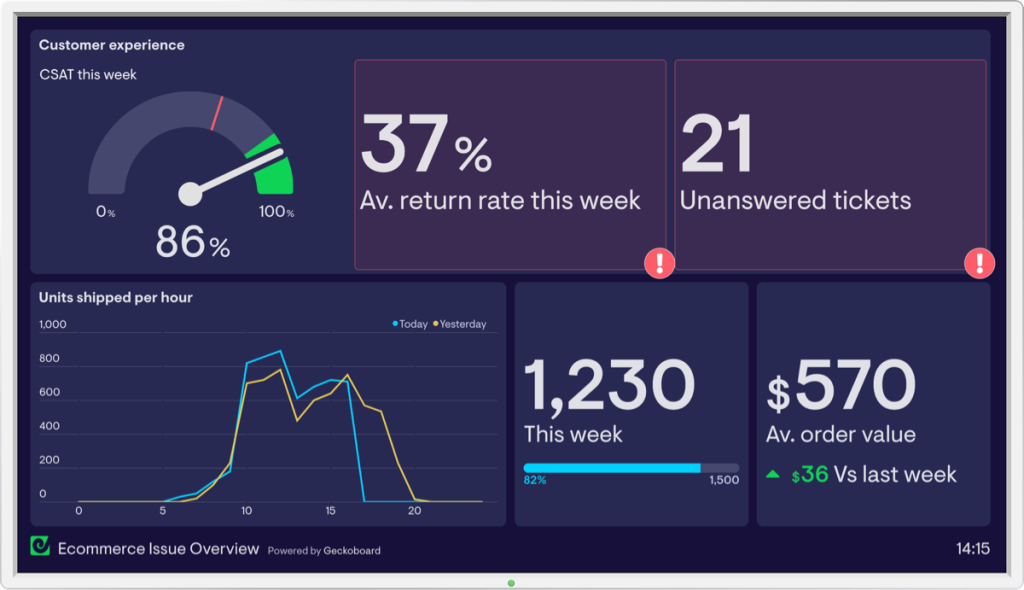
In the ever-evolving landscape of e-commerce, data is king. But raw data, much like a treasure chest locked tight, holds little value without the key to unlock its insights. Enter the e-commerce dashboard: a visual command center that transforms data into actionable intelligence, empowering businesses to make data-driven decisions and fuel growth
At Ciarus Technologies, we understand the importance of effective data visualization for e-commerce success. This article delves into the core principles of building powerful dashboards that translate complex information into clear, actionable insights.
Why Dashboards Matter for E-commerce
E-commerce businesses juggle a multitude of metrics—sales figures, customer behavior, marketing campaign performance, inventory levels, and more. While data is crucial, drowning in unorganized metrics can be overwhelming and hinder effective decision-making.

E-commerce dashboards provide a centralized platform to organize and visualize this data in a coherent and easily digestible manner. With the right metrics displayed visually, businesses can:
- Gain a Real-Time View: Monitor key performance indicators (KPIs) in real-time, allowing for swift adjustments to marketing strategies or operational bottlenecks.
- Identify Trends and Patterns: Spot emerging trends in customer behavior, product popularity, or website traffic, enabling proactive planning and optimization efforts.
- Measure Campaign Effectiveness: Track the performance of marketing campaigns across various channels, allowing for data-driven budget allocation and campaign refinement.
- Improve Customer Experience: Gain insights into customer behavior and preferences, leading to targeted marketing efforts, personalized recommendations, and improved conversion rates.
- Optimize Inventory Management: Monitor inventory levels and sales trends to ensure optimal stock levels, preventing overstocking or stockouts.
Crafting Effective E-commerce Dashboards
Building an impactful e-commerce dashboard goes beyond simply throwing data onto a screen. Here’s what you need to consider:
- Define Your Objectives: What are your key business goals? Knowing this will guide the selection of the most relevant KPIs to be displayed on your dashboard. Common goals include increasing sales, improving customer acquisition costs, or boosting conversion rates.
- Target Your Audience: Who will be using the dashboard? Tailor the dashboard layout and metrics to the specific needs of each user group (e.g., C-suite executives, marketing team, customer service representatives).
- Prioritize Clarity and Conciseness: Avoid information overload. Focus on the most critical KPIs, present them visually with clear labels and legends, and ensure the dashboard is easy to navigate.
- Data Visualization Techniques: Utilize various data visualization tools like charts, graphs, and tables to represent information effectively. Consider color schemes, data density, and user-friendliness when choosing visualizations.
- Drill-Down Functionality: Allow users to delve deeper into specific metrics by enabling them to click through to more detailed reports or data breakdowns.
Essential Metrics for Your E-commerce Dashboard
While the specific metrics will vary depending on your business goals, some key KPIs should be considered for most e-commerce dashboards:
- Sales Performance: Track total revenue, average order value, conversion rates, and abandoned cart rates.
- Customer Acquisition: Monitor website traffic sources, customer acquisition costs, and customer lifetime value.
- Marketing Performance: Analyze the effectiveness of marketing campaigns across various channels.
- Product Performance: Track top-selling products, product profitability, and customer reviews.
- Inventory Management: Monitor inventory levels, stockouts, and product lead times.
Beyond the Basics: Advanced Dashboard Features
For sophisticated e-commerce businesses, consider incorporating advanced features into your dashboard:
- Real-time Data Updates: Ensure your dashboard displays the latest data to facilitate real-time decision making.
- Interactive Features: Allow users to filter data, adjust timeframes, and customize dashboard views according to their needs.
- Predictive Analytics: Leverage machine learning and AI to predict future trends and customer behavior, enabling proactive planning.
- Alerts and Notifications: Set up automated alerts to notify users of critical changes in key metrics, allowing for immediate intervention.
Building Your E-commerce Dashboard with Ciarus Technologies
At Ciarus Technologies, we are experts in crafting custom e-commerce dashboards that empower businesses to unlock the true potential of their data. We leverage the latest data visualization tools and best practices to create dashboards that are informative, actionable, and user-friendly.

